What Sectional Times Measure
A greyhound’s overall race time tells you how fast it covered the full distance. Sectional times tell you how it covered that distance — where in the race it was quickest, where it lost ground, and how its effort was distributed across the bends and straights. The overall time is the headline. The sectionals are the story beneath it.
In UK greyhound racing, sectional times typically measure the dog’s run in two or three segments. The most common split is between the time to the first bend and the time from the first bend to the finish. Some tracks and data providers offer more granular breakdowns — split times at the second bend, third bend, and so on — but the primary split between early pace and finishing pace is the foundation of sectional analysis.
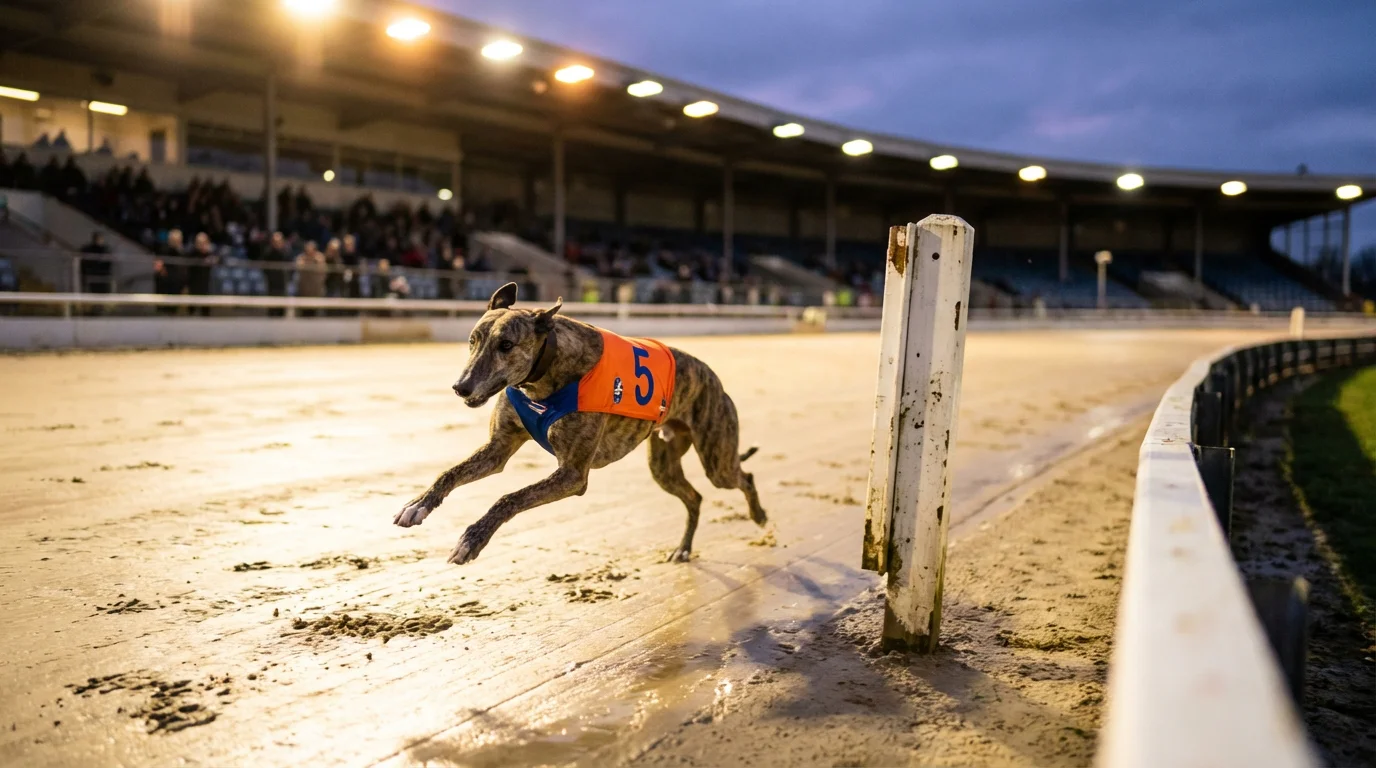
The time to the first bend, often called the first sectional or run-up time, measures how quickly a dog covers the distance from the traps to the first turn. This is the purest indicator of early speed in the race. A dog that consistently posts fast first sectionals is a confirmed front-runner — it gets out of the traps sharply, reaches the bend ahead of the field, and establishes the position from which it will try to control the race. The run-up sectional is less influenced by interference than any other part of the race, because the dogs have not yet converged at the bend, which makes it one of the most reliable form indicators available.
The remaining sectional — from the first bend to the finish — reveals a different set of attributes. It captures bending ability, sustained speed, stamina over the middle and closing stages, and the capacity to maintain effort after the initial burst. A dog with a fast first sectional but a slow closing sectional is a front-runner that fades. A dog with a slow first sectional but a rapid closing split is a closer — it saves energy early and finishes strongly. These are fundamentally different racing styles, and the sectionals make the distinction visible in a way that the overall time alone cannot.
Understanding what sectional times measure is the entry point. Using them to predict how a race will unfold is the skill that separates recreational bettors from those who treat the form book as a genuine analytical tool.
Early Pace vs Late Pace: Reading the Splits
The balance between early pace and late pace defines a greyhound’s racing character. Sectional times quantify that balance, and reading them correctly allows you to anticipate the shape of a race before it happens.
A dog with a consistently fast first sectional and a consistent closing split is a well-balanced runner. It leads and sustains, which is the most desirable profile in greyhound racing because it requires the least luck in running. A balanced dog does not need a clear run from behind or a perfect break from the traps — it simply runs its race and lets the others try to catch it.
A dog with a fast first sectional but a slow closing split is a front-runner that cannot sustain its effort. This is an important distinction from a balanced leader. The pure front-runner looks impressive for the first three-quarters of the race but is vulnerable to being caught in the final straight by a dog with more stamina. Backing this type of dog in sprint races, where the finish line arrives before the fade sets in, is reasonable. Backing it over middle distance or stayers trips, where the closing stages expose the stamina deficit, is risky.
A dog with a slow first sectional but a fast closing split is a closer. These dogs start slowly — either because they are naturally slow to stride out or because they cannot break from the traps quickly — and then accelerate through the field in the latter stages. Closers are exciting to watch but frustrating to back, because their success depends on getting a clean run through traffic. If the leaders hold their line through the bends and the closer cannot find a gap, the fast closing sectional goes to waste.
The most actionable use of this early-late split analysis is in race-shape prediction. If a race contains three confirmed early-pace dogs and two confirmed closers, the likely scenario is a contested lead through the first two bends — with one or more of the pace dogs tiring — followed by a closing challenge in the home straight. The closers benefit from the contested pace, because the leaders burn energy battling each other. Conversely, if only one dog has a fast first sectional and the rest are moderate, that lone pace dog is likely to control the race unchallenged, which makes it a stronger proposition than its overall time alone might suggest.
Sectionals also expose false form. A dog that won its last race with an impressive overall time might have done so on a night when no other dog in the race had genuine early pace. Its first sectional was fast by default rather than by merit. Place that dog in a race with two or three genuine early-pace rivals, and the sectionals predict that its comfortable lead will evaporate.
Comparing Sectional Times Across Tracks
Sectional times are track-specific, and comparing them between venues requires caution. The run-up distance to the first bend varies significantly across UK tracks — from as little as 50 metres at some venues to over 100 metres at others — which means the first sectional time is measuring different distances at different tracks. A dog with a 4.2-second first sectional at one track and a 3.8-second first sectional at another might have the same early pace — the difference is the distance being measured, not the dog’s speed.
Track geometry affects the closing sectional too. A track with sweeping, gentle bends allows dogs to maintain speed through the turns, producing faster closing splits. A tight track with sharp bends forces dogs to decelerate, which inflates the closing sectional regardless of the dog’s actual stamina. When a dog transfers from one track to another with a different configuration, its sectional profile may change even though its underlying ability has not.
For meaningful cross-track comparison, you need to normalise the sectionals against the track’s own benchmarks rather than comparing raw numbers. If the average first sectional for an A3 race at Doncaster is 4.10 and a dog posts 3.95, it is running 0.15 seconds faster than the grade average — that is the relevant comparison. If the same dog moves to a track where the average first sectional for an equivalent grade is 3.60 and it posts 3.50, it is again 0.10 faster than the grade average, suggesting similar early pace despite the very different raw numbers.
This normalisation is not something most racecard services do automatically, which means you need to build your own mental database of what typical sectionals look like at each track you regularly bet on. It takes time, but the investment pays dividends. A punter who understands what a fast first sectional looks like at Doncaster, Nottingham, and Romford can spot early-pace advantages that the raw numbers obscure.
Using Sectionals to Predict Race Shape
Race shape — the pattern of how a race unfolds from traps to finish — is largely predictable from sectional times, and predicting it gives you an advantage in every bet type from singles to forecasts.
Start by identifying the early-pace runners. Pull the first sectional times from the last three or four runs for each dog in the race. The dog with the fastest average first sectional is the most likely leader. If two or more dogs have similar first sectionals, you have a pace battle — they will contest the lead to the first bend, and the likely result is interference that benefits the dogs sitting behind them.
Next, identify the closers. The dogs with slow first sectionals but fast closing splits are the ones most likely to improve their position through the race. Their chances increase when the early pace is contested and the leaders tire. Their chances decrease when a single dog has a clear early-pace advantage and is allowed to dictate from the front unchallenged.
Now combine this with the trap draw. An early-pace dog drawn inside has the ideal setup — fast break, short route to the bend, clear lead. The same dog drawn on the outside has to break fast and cover more ground to reach the rail, which may blunt the very speed advantage that the sectionals reveal. A closer drawn inside may find itself boxed in on the rail behind tiring leaders with no room to move. The same closer drawn wide has a clear path to sweep around the field in the home straight.
The forecast and tricast implications are direct. If the sectionals and draw together suggest that one dog will lead and another will close into second, your forecast almost writes itself. The value comes from recognising this race shape before the market fully prices it in — particularly in the forecast pool, where the dividend is determined by how many other bettors identified the same outcome.
Sectional analysis does not guarantee correct predictions. Dogs have off days, breaks from the traps are unpredictable, and interference at the bends can disrupt even the most clearly projected race shape. But over a large number of races, the punter who reads sectionals and predicts race shape will outperform the punter who looks only at overall times and finishing positions.
Time Tells the Truth — If You Know How to Listen
Sectional times are the closest thing greyhound racing has to an honest witness. A finishing position can be flattering — a dog that finished second might have been beaten three lengths but still recorded a faster time than the third-place finisher who was only half a length further back. Sectional times cut through the ambiguity and show you what actually happened during the race, not just how the dogs crossed the line.
The skill is in reading them in context. A fast first sectional from a favourable inside draw is less impressive than the same time from Trap 5. A slow closing split after a wide run through three bends is more forgivable than the same split after a clear, unimpeded run on the rail. The numbers are the starting point, but the interpretation is what produces betting value.
Make sectional analysis a standard part of your racecard study. It adds five minutes to your preparation for each race and sharpens every subsequent decision you make about that race — from selection to bet type to stake size.